Reading aeronautical charts for drone pilots can be straightforward if you understand what to look for, and have patience. The more charts you use and look at, the easier they are to read and use to answer questions on the Part 107 Knowledge Test. Additionally, using the Legend in the Testing Supplement will help greatly in reading the chart.
Overview of Charts
An aeronautical chart is the road map for a pilot flying under Visual Flight Rules (VFR). The chart provides information that allows pilots to track their position and provides available information that enhances safety. The three types of aeronautical charts used by VFR pilots are:
- Sectional Charts
- VFR Terminal Area Charts
- World Aeronautical Charts
Remote Pilot Video Walkthrough and Practice Questions
Types of Charts
Sectional Charts
Sectional charts are the most common charts used by pilots today (and these are the types of charts used on the Remote Pilot Knowledge Test). The charts have a scale of 1:500,000 (1 inch = 6.86 nautical miles (NM) or approximately 8 statute miles (SM), which allows for more detailed information to be included on the chart.
The charts provide an abundance of information, including airport data, navigational aids, airspace, and topography. By referring to the chart legend, a pilot can interpret most of the information on the chart. A pilot should also check the chart for other legend information, which includes air traffic control (ATC) frequencies and information on airspace.
VFR Terminal Area Charts
VFR terminal area charts are helpful when flying in or near Class B airspace. They have a scale of 1:250,000 (1 inch = 3.43 NM or approximately 4 SM). These charts provide a more detailed display of topographical information. Whenever possible, remote pilots should use Terminal Area Charts (TAC) charts because of the increased amount of detail.
World Aeronautical Charts
World aeronautical charts are designed to provide a standard series of aeronautical charts, covering land areas of the world, at a size and scale convenient for navigation by moderate speed aircraft. They are produced at a scale of 1:1,000,000 (1 inch = 13.7 NM or approximately 16 SM). These charts are similar to sectional charts, and the symbols are the same except there is less detail due to the smaller scale. Generally these are not as useful to remote pilots due to the lack of detail.
Where to Find Aeronautical Charts
The FAA has a link to these here: http://www.faa.gov/air_traffic/flight_info/aeronav/digital_products/vfr/
Great free tools include VFRMap.com and Skyvector.com.
Latitude and Longitude
The Earth is divided in an imaginary grid pattern which allows us to identify any geographical point the planet.
The equator is an imaginary circle equidistant from the poles of the Earth. Circles parallel to the equator (lines running east and west) are parallels of latitude. They are used to measure degrees of latitude north (N) or south (S) of the equator. The latitude of the equator is 0°.
Meridians of longitude are drawn from the North Pole to the South Pole and are at right angles to the Equator. The “Prime Meridian,” which passes through Greenwich, England, is used as the zero line from which measurements are made in degrees east (E) and west (W) to 180°.
The 48 contiguous states are between 25° and 49° N latitude 67° and 125° W longitude.
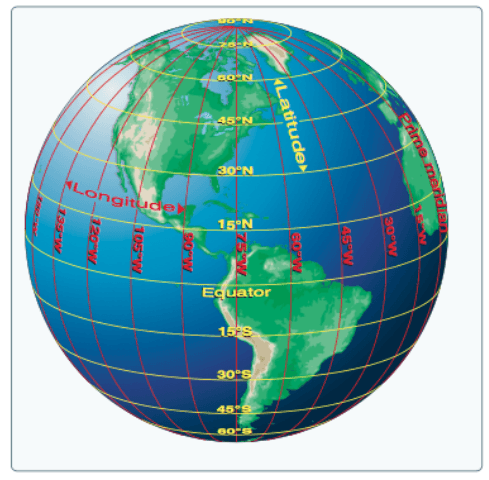
The easiest way to remember the difference between latitude and longitude is by associating the terms with different parts of a ladder. Lines of latitude run east and west. Think of the rungs of a ladder (which sounds somewhat similar to latitude) which run parallel to the equator.
To express the location of a point, one must use both latitude and longitude. For example New York is approximately located at 40º North (of the equator), 74º West (of the Greenwich meridian).
To pinpoint a precise point on Earth, we need more accuracy than a degree of latitude or longitude. Historically, degrees are divided in minutes and seconds (1 degree = 60 minutes, 1 minute = 60 seconds). Recent systems like GPS use decimals instead.
The Statue of Liberty is located at 40.6892° N, 74.0445° W,
or 40 Degrees 41 minutes and 21 seconds North, 74 degrees, 2 minutes 40 seconds West,
or 40º 41’ 21" N, 74º 2’ 40” W
To convert between decimal to minutes, just multiple the decimal value by 60.
For example, 40.6892° N, the decimal value is 0.6892. Multiplied by 60 = 41.352. This indicates 41 minutes. For the seconds, we take the next part of the decimal 0.352 and multiply by 60 = 21 seconds. Therefore, 40.6892° N = 40º 41’ 21" N.
Using the Sectional Chart
The sectional charts have elevation contours, and elevations listed (in colors) in MSL. Take Figure 22 for example. Most of the quadrants have an elevation between 6,600 feet to 7,400 feet.
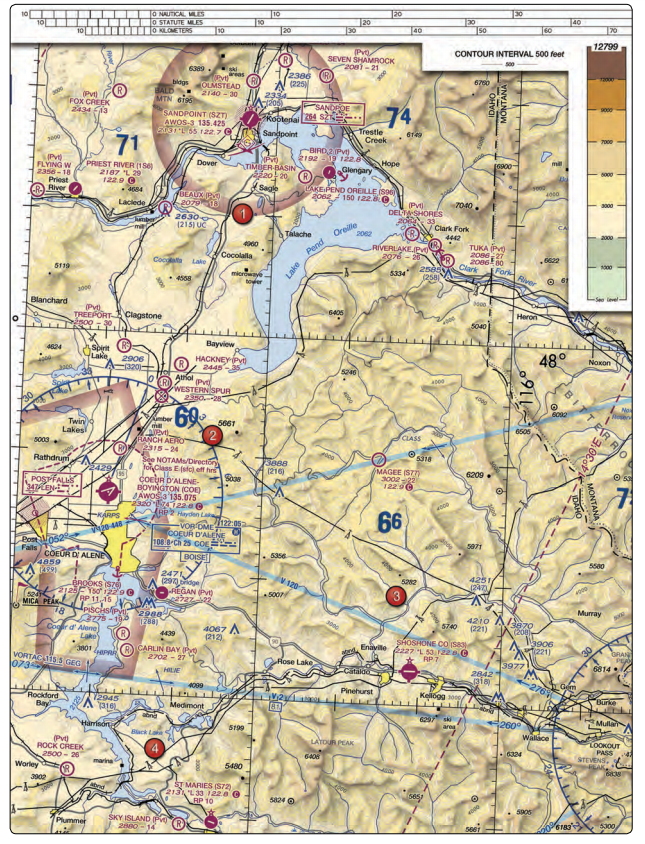
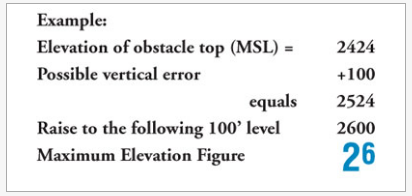
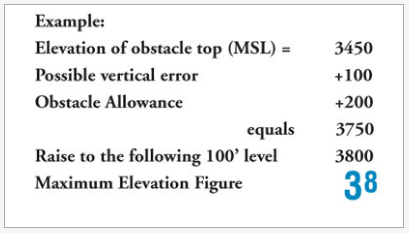
When determining the maximum elevation figure (MEF) of a quadrant, it is important to know that these figures are rounded up to the nearest 100 ft value and the last two digits are not shown.

It is important to note determining the maximum elevation figure of a quadrant depends on whether the highest obstacle is natural (like a tree) or man-made.
For a quadrant in which the highest obstacle is a tower,
For a quadrant in which the highest obstacle is natural,
Using the Legend
The legend found in the Testing Supplement is the most useful item you can learn to reference. You will have access to it on the test, and it includes Airports, data, obstructions, topographic information, and more.
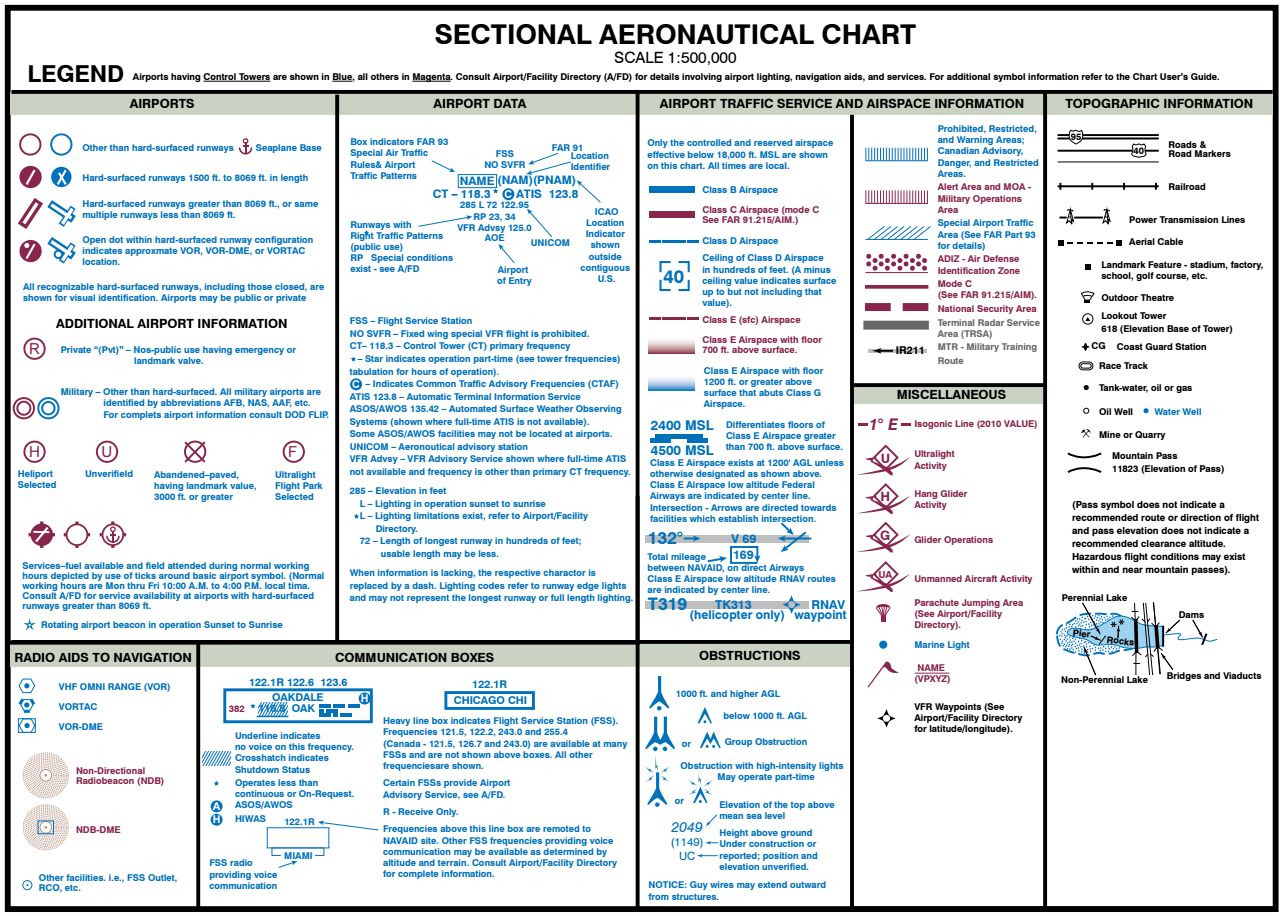
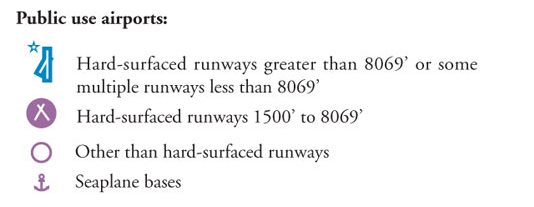
An important note about the airport symbols: Airports having control towers are shown in blue, all others in magenta.

It's important to note that runways of different material, lengths, and purposes are noted differently:
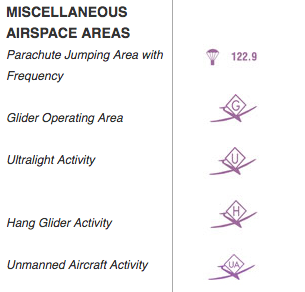
There are many other miscellaneous types of airspace noted on sectional charts:
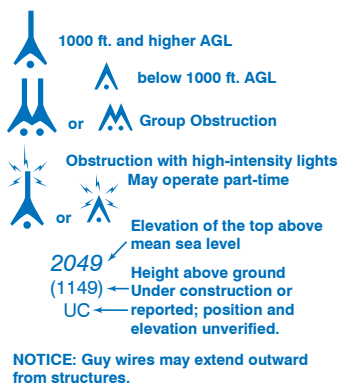
Obstructions are noted individually, in groups, less than 1000 ft AGL, greater than 1000 ft AGL, under construction, or if guy wires extend outward.
Sectional Chart Airport Information
There is a key on the Legend about how to read detailed Airport information on each of the Sectional Charts.
Using the Minot Intl Airport as an example (refer to Figure 21 in the Testing Supplement).
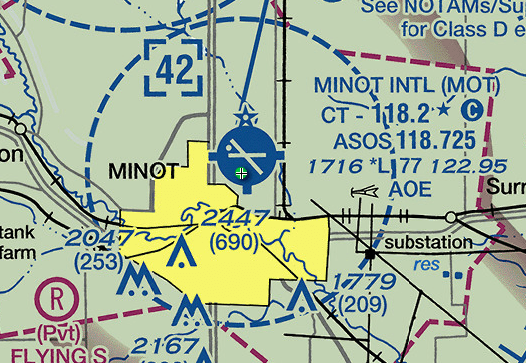
The Airport’s name is “Minot International Airport”.
The 3 letter airport identifier is “MOT”.
The airport has a control tower (blue symbol), and the Common Traffic Advisory Frequency (CTAF) frequency is 118.2* MHz. The * indicates the tower only operates part time. As a remote-pilot, you should monitor this frequency using an aviation hand-held radio to stay aware of the position of manned aircraft around you.
The weather is reported as ASOS frequency 118.725 MHz.
The airport elevation is 1,716 feet MSL (above mean sea level). The *L indicates lighting limitations of the runway exist.
The longest runway is 77 in hundreds of feet, which is in this case is 7,700 feet.
The UNICOM frequency is 122.95 MHz (Unicom is the Aeronautical advisory station).